I started simulating Premier League predictions because the one source of quality simulations on the internet was cruelly taken away. You can use bookmaker odds to answer probabilistic questions like “Who will win the title?” or “How likely is it that Brighton finish in the top 4?” but you are limited pretty quickly.
I hastily built my model to answer more involved questions with complete flexibility. “Will Leeds finish in the top 10?”, “Who finishes higher, Bournemouth or Fulham?” and “Will Southampton finish on fewer than 10 points?” are all within my power to answer.
I knew my system was lacking sophistication so this summer I took the opportunity to rewrite the codebase and improve the workflow for generating Premier League simulations each gameweek. What used to be a pile of .csv files, google sheets and 150 lines of shoddy python code is now a fully functioning, semi-automated Monte Carlo simulation with far reduced biases and better systems for predicting the final table outcomes.
TLDR: Model is a lot better now, room to improve still in the future.
What’s changed?
Dixon-Coles ρ Fitting and Increased Draw Prediction
The original simulation treated a match's home and away score as two independent Poisson-distributed random variables — no correlation between them at all. That's the standard naïve approach, and it's well documented in the football analytics literature that it systematically underproduces draws, particularly 0-0 and 1-1, relative to real match data.
The simplest fix is the Dixon-Coles adjustment (Dixon & Coles, 1997), a correction built directly on top of the same Poisson foundation rather than replacing it. Instead of sampling two independent variables, the model constructs the full joint probability matrix for a match — P(home = i, away = j) for every combination of i and j — as the outer product of the two teams' individual Poisson distributions. It then multiplies four specific cells (0-0, 1-0, 0-1, 1-1) by a correction factor τ, parameterized by a single leaguewide value ρ. Every other cell in the matrix is left as pure independent Poisson.
Since the τ correction isn't equal to 1 across those four cells, the probabilities no longer sums to exactly 1 after the multiplication — so the final step renormalises, dividing every cell by the new total, restoring a valid probability distribution before a scoreline is sampled from it.
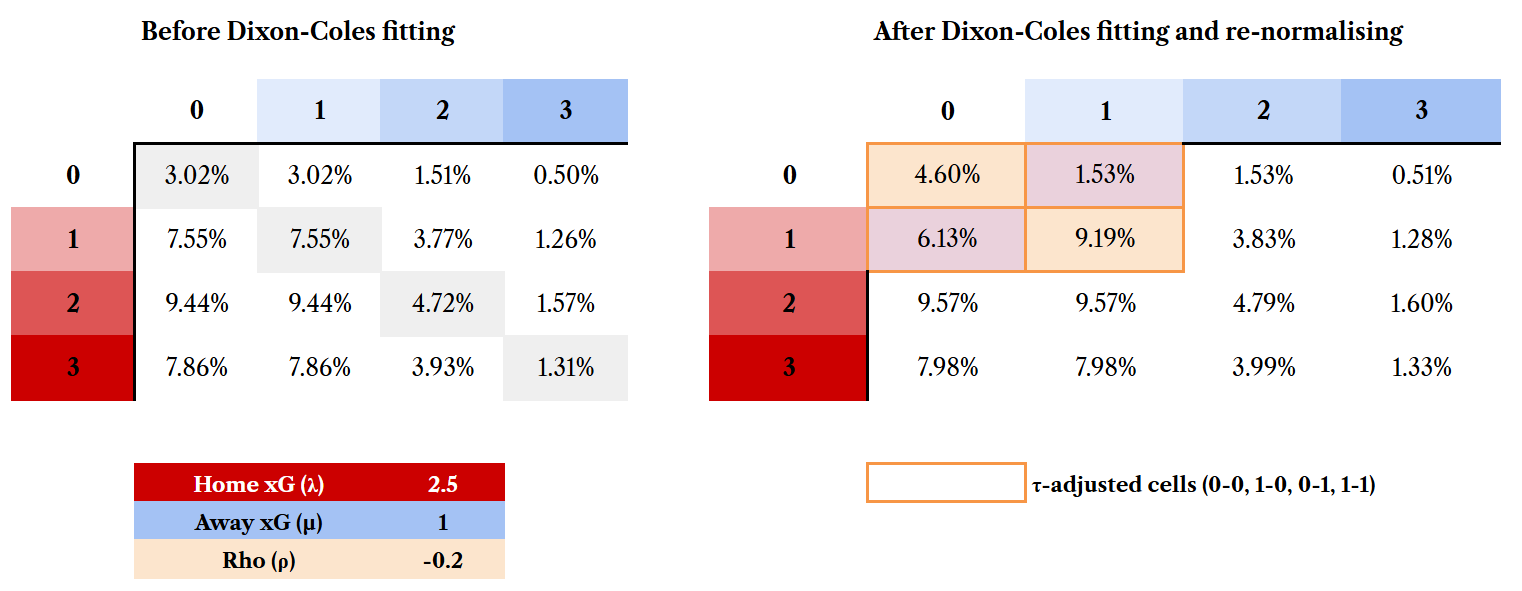
ρ was fitted specifically for this model via maximum likelihood on last season's own played matches — weighted by recency (an exponential decay favouring recent results) and down-weighted for matches affected by red cards, since a sending-off distorts a scoreline through a mechanism that has nothing to do with the tactical, game-state-driven correlation ρ is meant to capture.
What does this change? You will see an increased probability of draws in predictions. The overall points for the league will decrease slightly. There is a small hidden bump to teams with very low projected xG values’ projections in each game as they now become materially more likely to gain one point than none.
Rolling league baseline and self-correcting ratings
The old system used a single fixed baseline for home and away average xG — set once before the season, touched maybe twice all year. If the league's actual scoring rate drifted over the season the gap got silently absorbed into team ratings instead, which would drift to compensate for a stale assumption rather than reflecting true changes in team strength.
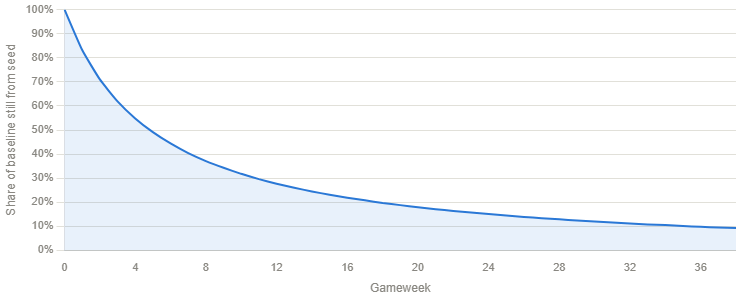
The new version recomputes that baseline fresh every time it's needed, as a time-weighted average of realised league-wide xG from every match played this season — recent matches count more than older ones, via the same exponential decay used elsewhere in the model. At the start of a season, with no match history yet, a pre-season estimate stands in as a single "phantom" observation that fades on the same curve as real matches arrive, so the baseline starts exactly at the seed value and gradually becomes almost entirely real-data-driven.
Alongside this, team ratings are renormalised to a league-wide mean every time they're updated, not just once at initialisation — a permanent property of how "current rating" is defined, rather than a correction applied after the fact. Without it, small asymmetries in individual updates could compound into a genuine drift over a season, quietly breaking the assumption the scoring baseline depends on.
Now a team’s current rating is guaranteed to be relevant to their league strength. If a team started the season with an Att rating of 1.05 and now has one of 1.1 it is definitively correct to say the team has a better attack relative to the league than they did originally.
Consolidated attack and defence parameters, venue as a log-scale adjustment
The original Glicko rating system treated a team's home form and away form as completely independent — four separate numbers (home attack, away attack, home defence, away defence) that updated on their own, with nothing tying a team's home identity to their away identity at all. Nothing prevented a team's home and away numbers drifting apart completely untethered, and this could create wild disparities in mid-season projections.
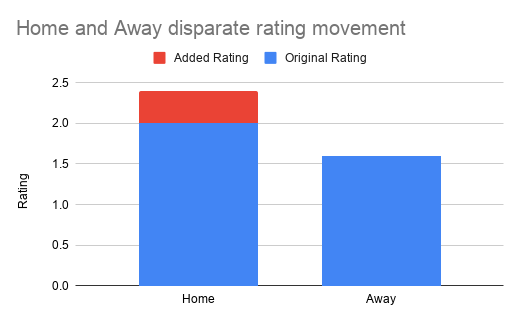
The new version instead gives each team two core numbers — one overall attack rating, one overall defence rating — plus an additional tilt measure, capturing how much better or worse they play at home versus away. The tilt parameters are stored on a log scale so the home multiplier and the away multiplier are exact reciprocals of each other: a team boosted 10% at home is automatically weakened by the matching amount away.
Every match — home or away — updates the overall rating fully. The tilt gets a smaller, venue-specific nudge, with its own slower learning rate and a gentle pull back toward zero each update, so a small early-season sample of home or away games can't overstate a team's split. The result: a team's headline strength converges faster, while their home/away character still emerges organically from real evidence, without diverging from the league-wide baseline.
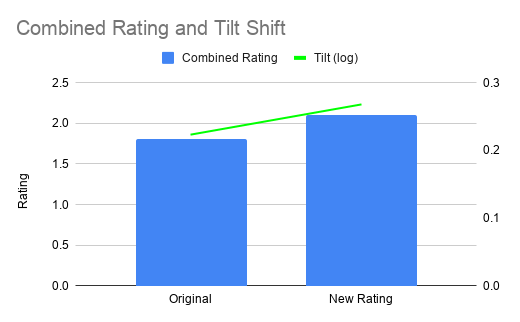
In the examples above, an overperformance at home now updates the overall rating of the team but for less than the original home rating would have been updated by, the difference is absorbed by the log tilt increase representing home skew.
Diminishing returns on outliers, momentum streaks
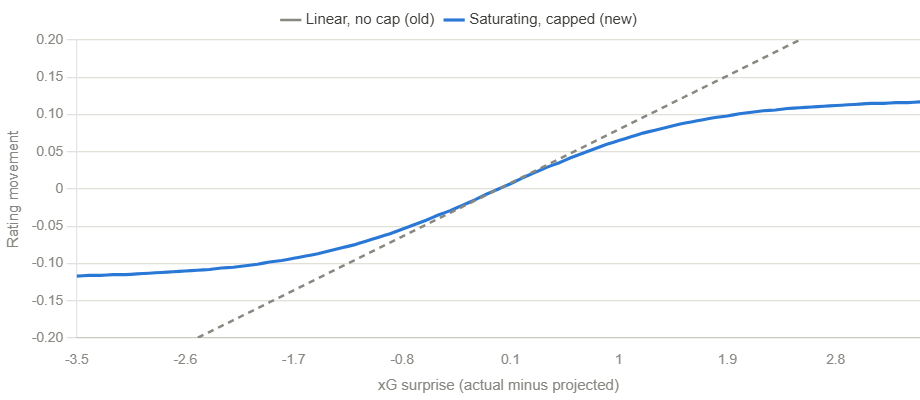
The old rating update moved linearly with the size of a match's surprise — the bigger the gap between projected and actual xG, the bigger the rating swing, with no ceiling. A single freak result could move a rating as much as several ordinary matches combined, distorting the number for weeks.
The new version first converts that surprise into a z-score, dividing by the expected spread (√projected xG) so a given raw gap means less for a team projected to score heavily than for one projected near zero. That z-score then passes through a saturation curve rather than a straight line: near zero it's almost perfectly linear, so ordinary results move ratings about as they always did, but past a threshold it asymptotically approaches a fixed ceiling no matter how extreme the underlying result gets. A outlying overperformance and an even further outlying one now move the rating by nearly the same, bounded amount.
One problem has always been moving teams who clearly are below or above their true rating, if you increase the scaling ratio too much then some teams who are efficiently rated will bounce up and down and the projections shift too much week to week, set the ratio too low and ratings will take half a season to catch up and the projections are equally inaccurate.
To combat this we have added a streak multiplier to over and underperformance. Attack and defence each track their own independent run of consecutive over- or under-performances — a team can be building attacking form while its defence is doing the opposite, tracked and rewarded separately rather than forced into one shared number. A consistent run accelerates the size of future updates, linearly, up to a capped multiplier; an isolated result gets no scaling boost at all. Matches affected by a red card are excluded from the streak count entirely, on either side, on the basis that a game played with a numerical disadvantage isn't a clean read of either team's underlying form.
Next areas to improve
Currently every fixture of the season is treated equally for ratings movement, however everyone knows that at the end of each season there are games that have little to no reflection on the true team’s ability. I’ve played around with fixture importance before. I want to expand this work and then use importance metrics to scale the ratings change for a given fixture.
My projections also assume that a team’s rating will stay fixed for the remainder of the season. It would be more accurate to run the season projection as an extension of life; on each projected week we project a ratings change and run this throughout the imaginary season as well as projecting the fixture results. This would introduce more naturalised variance into the system than my current methodology. The main limitation here is computing power, back of the envelope says even 10,000 seasons projected like this would take into days of runtime on my one machine. Watch this space.
Limitations and unanswered questions
Cup winning projections for the purpose of European qualification are taken from odds comparison website, not a terrible measure but I’d prefer a better source..
Likewise, I have to guess what the chances are of the Premier league attaining a 5th Champions League spot, if anyone has any data source or prediction market for this, let me know.
Fixture congestion and multiple competitions have a clear impact on team performance but I see no clear way to model that into its impact on projections and ratings updates.
Newly promoted teams present a headache. In the last seven seasons there has been exactly one team to be promoted and not finish that season bottom 5 in both att rating and def rating- Leeds 25/26. Any attempt to regress Championship performance into Premier League rating always places promoted teams as the three most likely to be relegated. This may not be inaccurate to life in the premier league but giving Hull a 91% chance of relegation doesn’t feel correct.